- 1.Compliance data and the Efron-Feldman model
- 2.Jin-Rubin Model of Principal Stratification
- 3.Compliance as a factor in genetic studies
- 4.Conclusions
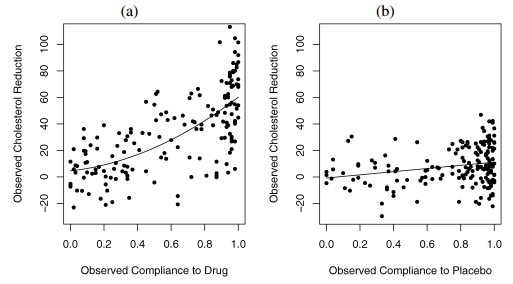
Figure 1. Overview of LRC-CPPT data in a) treatment and b) control groups. Figure from Jin and Rubin 2008.
TL;DR: Compliance is the actual proportion of the assigned pills a patient takes. In placebo group, the compliance reflects a patients psychological status; in treatment group, the compliance is (additionally) proportional to the active drugs received. We could use statistical modelling to better understand the treatment (causal) effect by considering the compliance as an explanatory variable.
1.Compliance data and the Efron-Feldman model
In modern drug tests, the response for a given patient is usually dependent on the actual dosage taken by the patient. In the 1991 Efron-Feldman study, the authors reported a subset of the data from the Lipid Research Clinics Coronary Primary Prevention Trial (LRC–CPPT), which was a placebo-controlled double-blind randomized clinical trial designed to study the effectiveness of cholestyramine for lowering cholesterol levels (referred to as the LRC-CPPT data hereafter). This was one of the earliest statistical studies on effects of noncompliance in randomized experiments.
The LRC-CPPT data is shown in Figure 1. In the LRC-CPPT data, 164 men were randomly assigned to the treatment group with active pills of the drug, whereas 171 men were randomly assigned to the control group with placebo pills. After 7-year follow-up, each man’s cholesterol level was measured before the trial and at the end of the trial. The outcome variable was the decrease in cholesterol level. The complication in this trial is that most of the patients in the experiment took only part of their assigned dose, which is typical partial-compliance behavior. The only data available to us are the treatment assignment, the proportion of the assigned drug or placebo taken, and the observed cholesterol reduction.
One interesting observation from the LRC-CPPT data is that the outcome (i.e. cholesterol reduction level) is also weakly but significantly related to the compliance in the control placebo group (Efron and Feldman, 1991). It is expected to observe a positive correlation between the outcome and compliance in the treatment group, as the compliance directly implies the actual dosage of pills taken; however, the fact that placebo compliance is correlated with the outcome indicates that more complex situations, namely compliance as an explanatory variable, need to be considered when estimating the drug dose-response curve. In the simplest case, a better compliance might be the result of the better family support and/or level of education received, which plays a role in the cholesterol reduction for the given patient in the long run.
Efron and Feldman devised a few properties for compliance as an explanatory variable because of its special nature. Specifically, compliance is an adjustable variable unlike variables like age. On the other hand, the compliance variable has different meanings in Treatment vs. Control groups. Compliance determines the amount of active drug taken in Treatment group; it also indicates something about the context for a particular patient, e.g. psychological status as suggested by Efron and Feldman. In the Control group, only the context component of compliance applies. Lastly, the Treatment and Control groups should behave identically at the 0% end of the compliance scale, because there is zero active drug dosage. See Figure 2 as an illustration for the relationships between the variables: treatment, compliance, active drug dosage and outcome.

Figure 2. Relationships between treatment assignment, compliance and outcome as formulated by Efron and Feldman (1991).
Having demonstrated the underlying assumptions, Efron and Feldman formulated their model accordingly. The overall goal of the modelling is to estimate a true drug dose-response function $\delta(X)=E[Y_x-Y_0]$. The expectation was defined as the appropriate averages over a population U, so $E[Y_x-Y_0]=\sum(Y_x(u)-Y_0(u))/N$, where u is an individual from a population U, and N being the number of elements in U. This is also called average causal effect of X on response by Rubin and Holland. Based on the data distribution in Figure 1, the compliance was assumed to have a linear relationship with the cholesterol reduction in the Control group, z. For differences between outcomes in the Treatment and Control groups, denoted by D(z)=T(z)-C(z), was modeled quadratically as $D(z)=d_1\cdot z+d_2\cdot z^2$. If there is no interaction between the dose X and the placebo effect $y_0$ and the outcome is purely additive of X and $y_0$, then the true dose-response function $\delta(z)=D(z)$; otherwise, the true dose-response function depends on another continuous function H(x) that we need to specify. In the Efron-Feldman paper, the authors specified $H(x(u))=h_1 \cdot z$ and $x=s(u)\cdot z(u)$. This is basically modelling the individual-specific baseline level is likely to affect the outcome after conditioned on the dosage. The authors also commented that the interaction term has one degree of freedom, similar to Tukey’s test for interactions in a two-way ANOVA study without replication; therefore, specifying the interaction term will enable more sensitive statistical tests.
One pitfall of the Efron-Feldman model is in their transformation of the Control group compliance in order to satisfy “Perfectly Blind” assumption. In the LRC-CPPT data, the compliance distribution in Treatment and Control groups were clearly different (Figure 3). However, since the Efron-Feldman model assumes no interaction between treatment assignment and the compliance (Figure 2), the model asserts the compliance between the two groups should be identical; subsequently, the Control group compliance values were rank-transformed to match their counterparts in the Treatment group. As we will see in the next section, this somewhat overly restrictive assumption was corrected in the Jin-Rubin model of principal stratification.
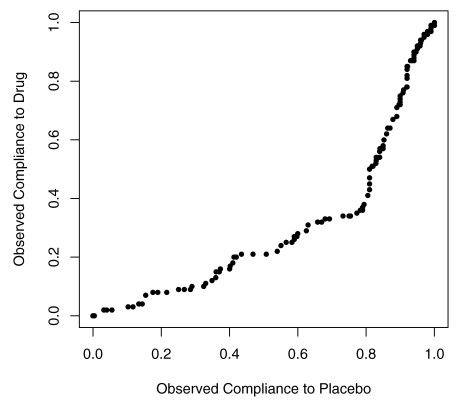
Figure 3. QQ-plot for observed drug compliance and placebo compliance in the LRT-CPPT data.
2.Jin-Rubin Model of Principal Stratification
In 2008, Jin and Rubin re-analyzed the LRC-CPPT data with principal stratification modelling. Similar to the Efron and Feldman paper, the Jin and Rubin analyses aimed to answer how much of the greater cholesterol reduction in the treatment group is caused by taking more drug. Their approaches were different from the EF model, in that their model considers the effect of the treatment on the compliance. See Figure 4 as an illustration for the Jin Rubin model. The compliance to drug differs from the compliance to placebo, with a greater proportion at the lower compliance levels for those assigned drug and a greater proportion at the higher compliance levels for those assigned placebo. This difference is possibly due to the adverse side effects of the drug, which include increased colonic gas, and may induce some people to stop taking it. These are practically issues that should be considered in the modelling.
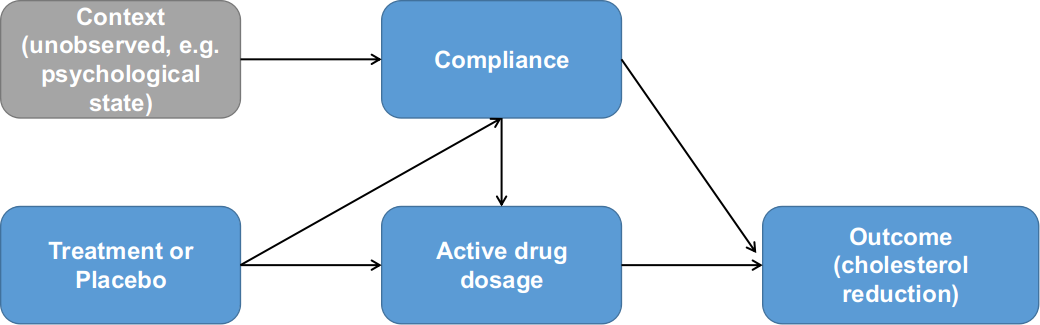
Figure 4. Relationships between treatment assignment, compliance and outcome as formulated by Jin and Rubin (2008). Note the additional dependency between compliance and treatment assignment.
The Jin Rubin paper first introduces the standard primitives in the Rubin Causal Model as: average causal effects $\bar{E}=\bar{Y}(T)-\bar{Y}(C)$, the same quantity as in the Efron-Feldman model; and the individual-level causal effects of the treatment assigned for patient i as $E_i=Y_i(T)-Y_i(C)$. Additionally, between the fine-grind individual-level causal effect $E_i$ and the coarse-grind population-average causal effect $\bar{E}$, the authors further defined the “principal causal effect” in a given stratum S as $\bar{E}s=AV E_{i \in S} [Y_i(T)-Y_i(C)]$. The principal causal effect is the primary quantity of interest in the Jin-Rubin model. In the simplest binary compliance case, there are four principal strata for patients: compliers, never-takers, always-takers, and defiers, and the principal causal effect is defined by grouping patients into these four strata groups. In the Jin and Rubin 2008 paper, the authors extended the binary framework to partial compliance, in the sense that the compliance could take continuous values between 0 and 1. Specifically, a strata for patient i is defined as $S_i=[D_i(T), d_i(C)]$, where $D_i(T)$ denotes the proportion of active treatment received by patient i if assigned treatment, $d_i(C)$ denotes the proportion of placebo received by patient i if assigned control. The framework is capable of modelling additional strata elements $D_i(C)$ and $d_i(T)$ for the level of received placebo when assigned treatment and likewise for the received active drug when assigned control; these two variables were assumed to be 0 in the Jin Rubin paper.
Based on this, Jin and Rubin defined a Bayesian Parametric model for this inference problem. For each patient i assigned to Treatment group, they regarded $d_i(C)$ as missing data; and likewise for patient i assigned to Control group, they regarded $D_i(T)$ as missing data. Hence for each patient, the strata $S_i=[D_i(T), d_i(C)]$, or more simply, $S_i=[D_i, d_i]$, has the prior distribution specified, where $d_i|\theta \sim Beta(\alpha_1, \alpha_2)$, and $\frac{D_i}{d_i}|d_i,\theta \sim Beta(\alpha_3, \alpha_4)$. Recall that $d_i$ is considered as a surrogate for the psychological status in the Control group. The specification of the treatment compliance is interesting, because it follows the negative side-effect monotonicity so that the compliance of the drug $D_i$ is always a proportion to that of the placebo $d_i$ for any given patient i. In other words, the effect of negative side-effect monotonicity was considered to be sampled from $Beta(\alpha_3,\alpha_4)$. Then the Jin-Rubin model can effectively dissect the different components contributing to the outcome as:
\[Y_i(C)|D_i,d_i,\theta \sim N(\beta_0+\beta_1D_i+\beta_2d_i, \sigma_c^2)\] \[Y_i(T)|D_i,d_i,\theta \sim N(\gamma_0+\gamma_1D_i+\gamma_2D_i^2, \sigma_T^2)\]That is, the average outcome for the control group $Y_i(C)$ is linearly determined by their psychological status surrogate $d_i$ and the level of active drugs received had they been assigned to the Treatment group. By contrast, the average outcome for the treatment group $Y_i(T)$ has a quadratic relationship with the active drugs received plus an additive effect from their psychological status $d_i$, similar to the EF model. The parameters can be estimated from the complete likelihood model following missing data optimizer like Expectation-Maximization or a Bayesian equivalent Gibbs sampler. Note that the Jin-Rubin model only assumed the stratum for patient i was missing and could be subsequently sampled, but not the outcome had a patient be assigned to an alternative treatment or control group. This is also consistent with the assumption that the compliance or more generally the stratum is an inherent attribute for a given patient, as remarked by Efron and Feldman in their 1991 paper.
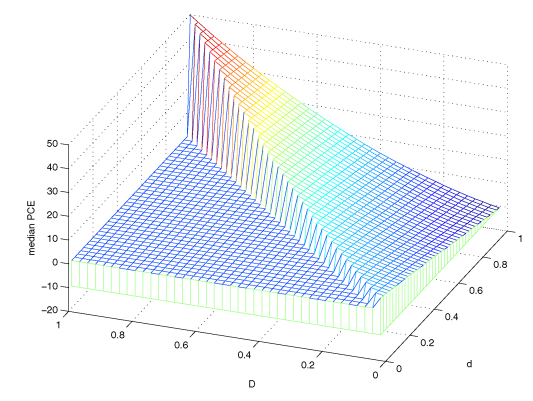
Figure 5. Posterior mode for Principal causal effects. Figure from Jin and Rubin (2008).
The results from the Jin Rubin model are shown in Figure 5. By construction, only the D < d triangular was defined on the horizontal plane. The surface of these posterior medians ranged from the lowest point -13 at principal stratum (0,1) to the highest point 50 at principal stratum (1,1). Thus, given the value of d, the type of compliance under control (i.e. the surrogate for the psychological status), the estimated principal causal effect increases as D increases. With this landscape of principal causal effects, we can effectively map any patient i with stratum $S_i(D_i,d_i)$ to a specific estimate of the causal effect given an active drug treatment.
An intriguing observation from this model is for principal stratum (0,1) where the causal effect is negative. In plain English, that means a man with very good psychological status but suffering from extreme negative side-effects will actually have worse outcome (i.e. less cholesterol reduction) if assigned to the active drug group as compared to the case had he been taking placebo. In practice, such a “critical” boundary between the positive and negative principal causal effect is of great importance when it comes to assigning the active drugs to patients with different levels of negative side-effects.
The Jin Rubin also proposed a second model for estimating the true drug dose-response function within principal strata defined by $d_i$ based on a hypothetical experiment. In general, the idea involves different assigned stochastic dosage based on certain rules solely depends on the patient’s psychological compliance denoted by $d_i^{*}$, but the treatment group $d_i^{*}$ is missing and we forgot our assignment rules. In essence the hypothetical experiment replaced the observed $D_i(T)$ with a more complex dose-response structure $Z_D$ to estimate the true dose-response.
3.Compliance as a factor in genetic studies
Modelling the compliance as an explanatory variable in the drug-response experiments also has profound implication in the modern genetics and biology studies. To demonstrate this, we first introduce the infamous “central dogma” in biology, i.e. the information flow of all living organisms is passed from DNA through RNA and finally to protein as the basic functional units (Figure 6). Generally speaking, a phenotype (e.g. height, Body Mass Index, or risk of a particular complex disease, etc.) for any individual is determined by the functional efficiency of one protein (i.e. Mendelian traits) or a set of proteins (i.e. complex traits) which is/are in turn controlled by the DNA. Individuals in a population will process differences in their DNA, called genetic variants, that caused the phenotypical differences. For example, the height variance is estimated to be ~70% determined by multiple genetic variants across the genome, with the remaining 30% determined by the environment. By contrast, Huntington’s disease is caused by one particular disease-causing gene namely Huntingtin.
For most genes/locus in the genome, there are only two versions in the population; we call the version more prevalent in the population as reference allele, denoted by X=0, while the other version we call as alternative allele denoted by X=1, a natural resemblance to the Treatment-Control experiment. Under mild assumptions, the two versions of the target gene have reached equilibrium in a stable population and randomized among individuals. We are interested in estimating the average causal effects of the genetic variant X on an outcome Y defined as $E=E_{i\in U}[Y_i(X=1)-Y_i(X=0)]$ in a population U. As shown in Figure 6, the complication comes from the information flow through RNA, denoted as $Z_i$ for individual i, which is the equivalent to the compliance variable in the LRC-CPPT data. Importantly, the RNA level $Z_i$ is an inherent attribute for individual i, since every gene is in the context of a complex individual-specific regulatory network, and the variation of $[Z_i|X_i=0]$ in the reference group reflects some baseline status similar to the psychological status in the control group of the LRC-CPPT study; however, the variation of $[Z_i|X_i=1]$ in the alternative group has different meanings in that it also determines the dosage of the alternative protein. Furthermore, when there is $Z_i=0$ on the RNA level, both the amounts of reference and alternative proteins are 0, hence $Y_i(X=0|Z=0)$, similar to the zero-compliance case. In some genes, the genetic variant $X_i$ is also related to the RNA level $Z_i$, a scenario depicted as negative side-effects in the Jin and Rubin 2008 paper.
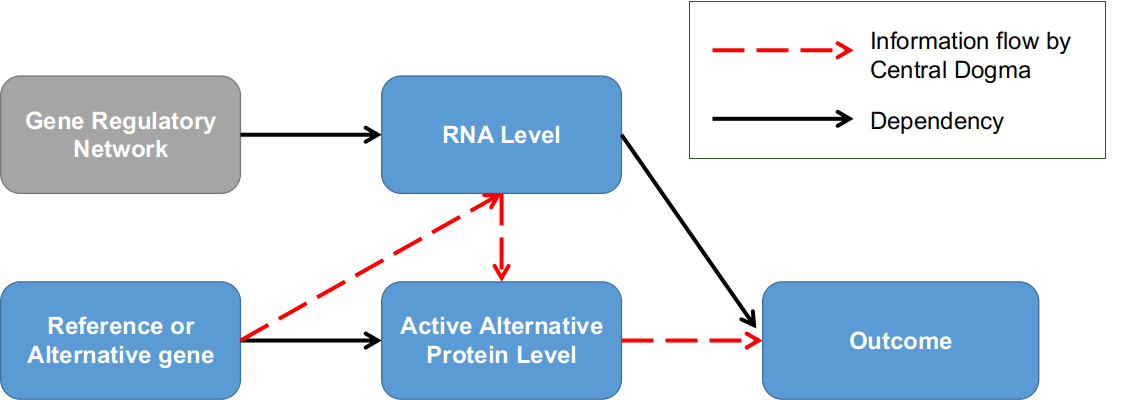
Figure 6. Genetic association studies in the context of the dose-compliance-response framework. Individuals are grouped into two groups by whether having the alternative version of the target gene; RNA level is the equivalent to compliance factor.
Conventional genetic studies like Genome-wide Association Study (GWAS) did not consider the gene’s RNA level when studying the correlation relationships between the genetic variants and a phenotypical outcome, either due to the lack of supporting data measurements of RNA level or the lack of statistical considerations. In recent years, there have emerged some genetic studies that utilize RNA levels as a factor to prioritize the functional causal genetic variants for phenotype variations, among them a popular and power approach was Transcriptome-wide Association Study (TWAS).
4.Conclusions
We reviewed the statistical studies that consider drug compliance as an explanatory variable to estimate the causal effect in a randomized treatment-control experimental design. We introduced the LRC-CPPT dataset, which is main example for studying the dosage-compliance-response study and was used by both Efron Feldman and Jin Rubin papers. We recapitulated the statistical models used by Efron-Feldman and Jin-Rubin that utilized different assumptions and approaches to estimate the average causal effect (EF) and principal causal effect (JR) for the active drug. Finally, we discussed the similarity of the compliance factor in the context of genetic studies and extended the potential applications of the compliance causal inference models to the field of genetic association studies.